Note: These tutorials are incomplete. More complete versions are being made available for our members. Sign up for free.

K-mer Distribution
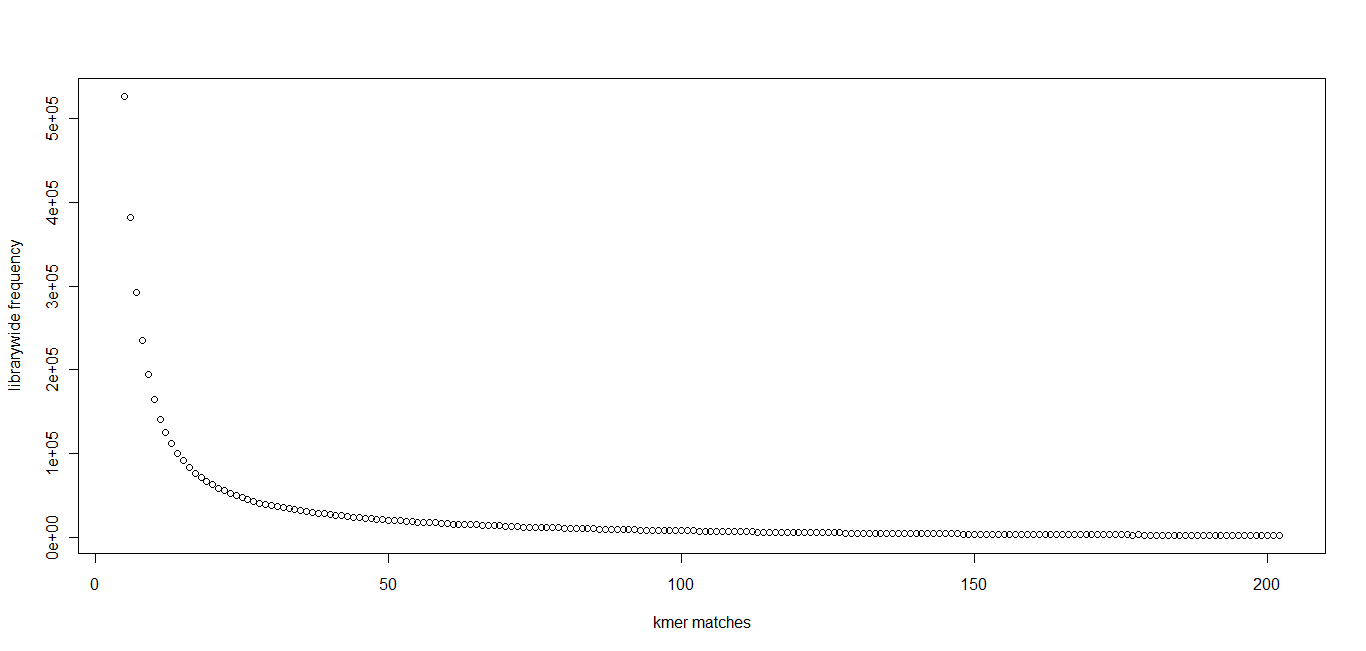
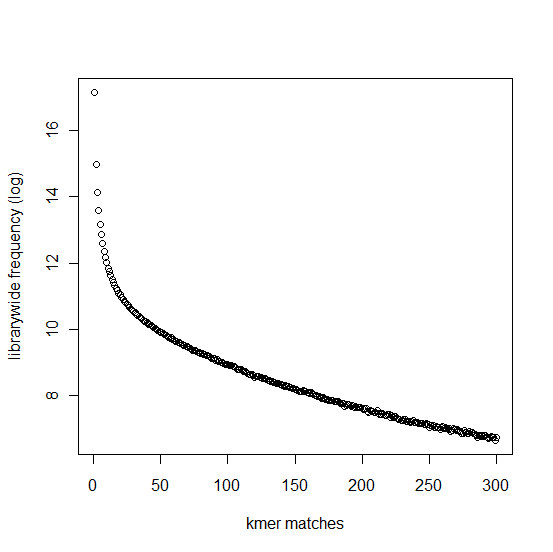
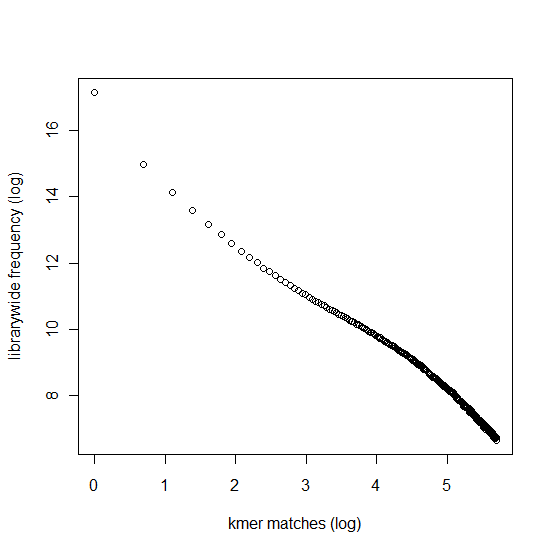
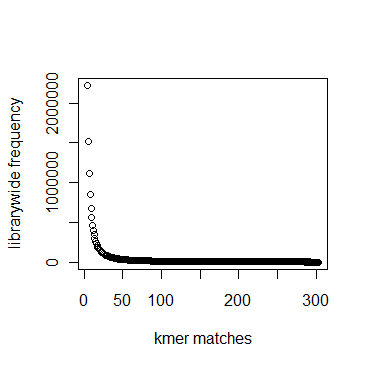
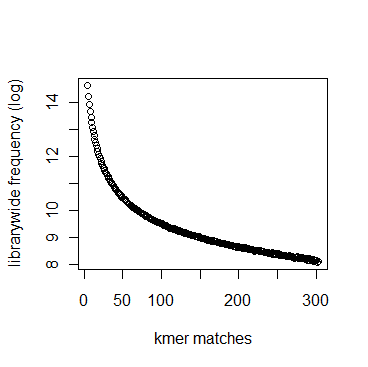
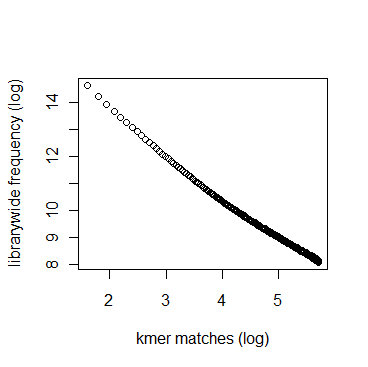
In section 3.1, we displayed a typical K-mer distribution of genomic libraries and showed that the K-mer distribution usually contained two peaks - (i) noise peak near K=1 and (ii) another peak at higher K corresponding to the sequencing depth of the genome. In contrast, the K-mer distribution of RNAseq often contains only the noise peak at K=1 and no other peak at higher K. The following charts show K-mer distribution for a transcriptome (RNA-seq) library with 100 million reads of sizes 100 nucleotide each. Three plots below present the same data in linear-linear, linear-log and log-log scales.
We repeated the above calculation with over 700 million 100nt transcriptome reads and show the K-mer distribution below. The distributions look similar to the above plots lacking any peak other than at K=1.
Intuitively the above result makes sense. A transcriptome contains many different RNA sequences, and each type is expressed at a different level. Therefore, the coverage of those RNA sequences vary, thus averaging out their second peak. This is best understood by following the mathematical description of Chaisson et al., who showed that the K-mer distribution of genomic libraries can be described as summation of two distributions - (i) a Poisson distribution at K=1 and (ii) a binomial distribution with peak at coverage depth. In the same way, the K-mer distribution of transcriptomic library can be described as summation of many such Poisson distributions, each with peak at K=1 and many bionomial distributions of different peaks. Those peaks wash out leaving us with a unimodal curve with peak at K=1.