Note: These tutorials are incomplete. More complete versions are being made available for our members. Sign up for free.

De Bruijn Graph
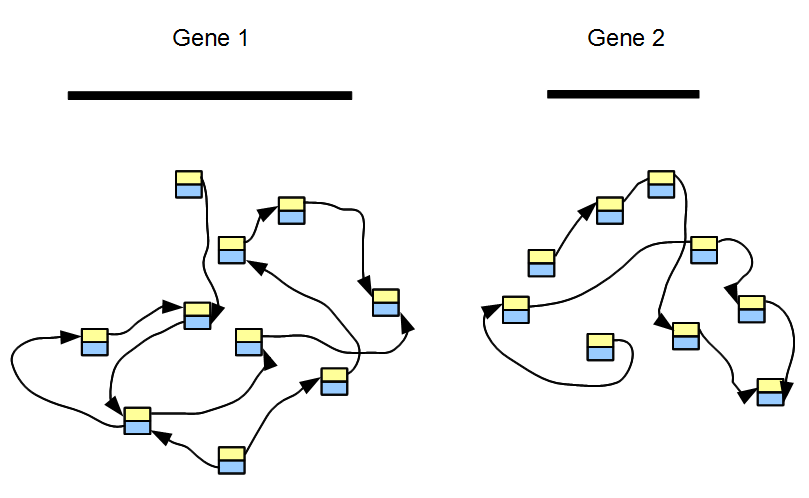
RNAseq sample contains sequences from thousands of genes. The topology of its de Bruijn graph is not too different from the same for gene regions of the underlying genome. The difference lies in relative frequencies of short reads covering various nodes. To explain the difference, we first consider a transcriptome with only two genes, among which one is expressed 100 times the other. The de Bruijn graph of each gene can be constructed separately, as shown in the above figure. If two genes do not have any common k-mer, the de Bruijn graph of our two-gene transcriptome consists of two separate graphs without any cross-link.
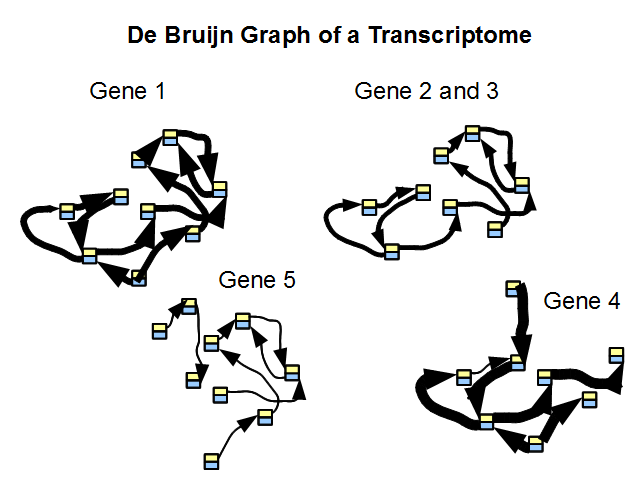
Given that the sequences for most genes in a large genome or transcriptome do not have much overlap, the de Bruijn graph of a transcriptome is indeed a collection of many disjoint graphs, each representing a single gene or a family of genes. The repeat issue plaguing genome assembly is far less important for transcriptome. In above figure, we considered de Bruijn graph of five genes along with their coverage. Genes 2 and 3 are either alternatively spliced versions of the same gene, or two highly similar genes from the same family.
Going back to the transcriptome of two genes, when the short NGS reads are mapped on to de Bruijn graph of a transcriptome, genes with different expression levels have different number of read coverage. K-mers with very high occurrence may come from highly expressed genes and k-mers with low occurrence may come from low abundance genes. Those extremes are what make transcriptome data most interesting.
In the following picture, we show de Bruijn graph of five genes along with their coverage. Genes 2 and 3 are either alternatively spliced version of the same gene, or come from the same family.
What problems would a genome assembler encounter in trying to assemble the above transcriptome library? In an NGS library of a genome, all regions of the genome are represented uniformly. Therefore, if some k-mers have high occurrence, they are likely from repetitive regions of the genome. Very low occurrence k-mers, on the other hand, are results of sequencing errors. Many short read genome assembly programs tune themselves to k-mers of average frequency (equal to sequencing depth) and reject k-mers with very high or very low frequencies in the first pass.