Note: These tutorials are incomplete. More complete versions are being made available for our members. Sign up for free.

Why use de Bruijn Graphs for Genome Assembly?
If genomes were completely random sequences in a statistical sense, ‘overlap-consensus-layout’ method would have been enough to assemble large genomes from Sanger reads. In contrast, real genomes often have long repetitive regions, and they are hard to assemble using overlap-consensus-layout approach. De Bruijn graph-based assembly approach was originally proposed to handle the assembly of repetitive regions better.
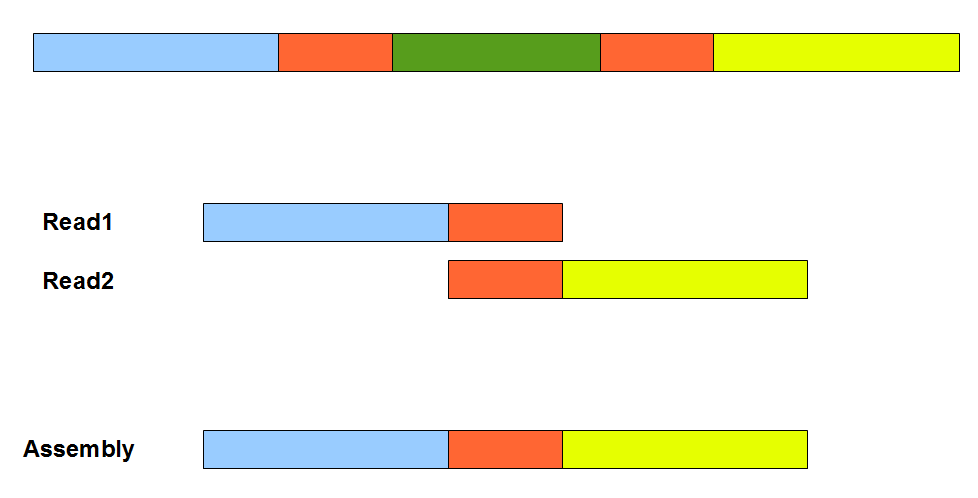
The above figure provides a simplistic illustration of how an assembly error can appear from a repetitive region. Two orange segments in the figure are nearly identical. Therefore, an overlap-consensus-layout assembler may make the mistake of erroneously connecting the blue and yellow segments, and skip the green segment in between. To properly handle repetitive regions as in the figure, overlap-consensus-layout programs mask repetitive and low-complexity regions and assemble the remaining genome into many contigs and scaffolds. Then an expensive completion step is employed to merge scaffolds into super-scaffolds and fill up the repeats. Readers should note that the assembly errors like above can appear irrespective of whether the underlying reads are erroneous or clean. Presence of sequencing errors can only exacerbate the situation. An overlap-consensus-layout assembler needs to constantly guess whether slight variation between two overlapping segments is due to repeats or error. A number of tricks are employed to distinguish between the two, including using quality scores. Also the ends of reads are clipped to minimize potential errors.
In 2001, Pevzner, Tang and Waterman extended earlier ideas developed for sequencing by hybridization to propose an alternative genome assembly algorithm. Their novel method successfully assembled the highly repetitive genome of bacteria Neisseria meningitidis (NM), which posed challenge to traditional assemblers. Assemblers like phrap, cap3 and tigr made 5, 4 and 2 errors respectively even with completely error-free reads from the NM genome. With real data, the number of errors increased to 17, 14 and 9. In contrast, de Bruijn graph-based EULER program developed by Pevzner et al. did not make any assembly error and produced better assembly covering the genome with fewer contigs. Two factors contributed to EULER’s success. Firstly, it did not mask the repetitive regions and instead considered them on equal basis with all other genomic regions. Secondly, it was able to correct small sequencing errors in reads. The error correction scheme worked better with increasing sequencing depth.
Despite its apparent success, de Bruijn graph-based approach was not commonly used for Sanger reads. That changed with the arrival of next-generation sequencing (NGS) technologies. NGS instruments could rapidly and inexpensively decode the sequences of millions of small fragments, but the read sizes were an order of magnitude shorter than the same from established Sanger technology. Overlap-consensus-layout methods broke down completely for those short reads, because finding overlaps between all read pairs scaled quadratically with the number of reads. Moreover, with shorter reads, it was more common to find spurious overlaps between read pairs. De Bruijn graph-based assembly approach became natural fit with its ability to benefit from both characteristics of NGS data, namely large volume and short size.
Unlike overlap-consensus-layout methods belaboring to merge Sanger reads into longer sequences based on mutual overlaps, de Bruijn graph-based assemblers work by splitting the short reads (70-100mer) into even shorter units of uniform size. That may appear counter-intuitive. How is it possible to solve a zigsaw puzzle by pulverizing the puzzle pieces? The answer is that the de Bruijn graph-based assemblers do not fully ‘pulverize’ the short reads into smallest components (‘A’, ‘T’, ‘C’, ‘G’). If the pieces are tiny, they collectively lose all characteristics of the genome. For example, it is not possible to reconstruct a genome, if all short reads are broken into 2-mers, 3-mers or even 10-mers. However, there comes a sweet spot in piece size, where the collection of pieces retain enough characteristics of the genome to allow its reconstruction, yet are short enough to provide detailed statistics on the pieces for error correction. More importantly, the tiny nucleotide pieces do not completely lose their contextual information after being fragmented from short-reads. Their local connectivity is preserved by de Bruijn graph structure.
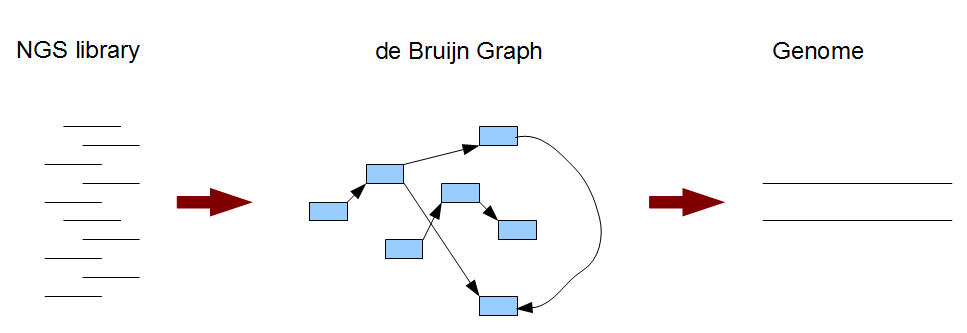
Typically a de Bruijn graph-based genome assembly algorithm works in two steps. In the first step, short reads are broken into small pieces (k-mers) and a de Bruijn graph is constructed from those short pieces. In the next step, the genome is derived from the de Brujin graph. For easier understanding of the whole process, we will look into the steps in reverse order. In Section 2, we will learn about what the de Bruijn graph of a genome looks like. Then, in Section 3, we will understand the nature of de Bruijn graphs constructed from short reads and the genome assembly procedure. Section 4-6 will reinforce the concepts through illustrations of de Bruijn graphs for many different applications.