Note: These tutorials are incomplete. More complete versions are being made available for our members. Sign up for free.

Assembling Genomes from Perfect Reads
Imagine we have a genome, whose de Bruijn graph looks like the following figure.
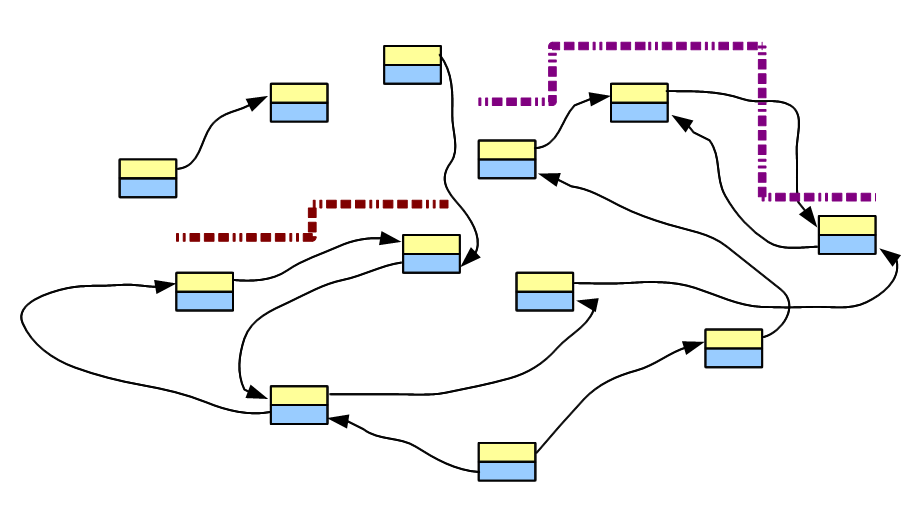
We chemicallly parse the chromosomes in an uniform manner and sequence the generated fragments using any popular short read technology. To keep our discussion simple, we assume error-free reads and relatively uniform coverage of the genome. In absence of sequencing errors, each tiny read matches the genome perfectly. Therefore, the de Bruijn graph constructed from a read goes over the corresponding nodes and edges of de Bruijn graph of the genome. In the above figure, two short reads are displayed in red and purple next to the de Bruijn graph part of the underlying genome, with which they match.
When the above process is repeated millions of times for all short reads, each read will capture some part of the genome and align with its corresponding de Bruijn graph. Therefore, if we uniformly sequence billions of short reads from the entire genome and construct a giant de Bruijn graph from those short reads, that de Bruijn graph will look identical to the de Bruijn graph of the underlying genome.
While constructing the graph, we also need to keep track of how many short reads match each node. If the genome is repeat-free and the sequencing is done with perfect uniformity at a depth of 50 (or N), each node in the de Bruijn graph is visited by exactly 50 (or N) short reads. In that case, constructing most parts of the genome from the de bruijn graph is relatively easy. Real world genomes have repetitive sequences and all short read technologies introduce sequencing errors to some degree. Resolving errors and artifacts is where the major challenge lies for various assembly programs.
Based on above discussion, we can make an observation about repetitive regions. In an error-free and uniform sequencing situation, if almost all nodes of the de Bruijn graph are visited by 50 short reads, but a small subset are visited by 200 short reads, one can argue that the underlying sequence near those nodes constitute repeats present four times in the genome. Therefore, de Bruijn graphs provide an easy way to estimate how repetitive a particular region is.
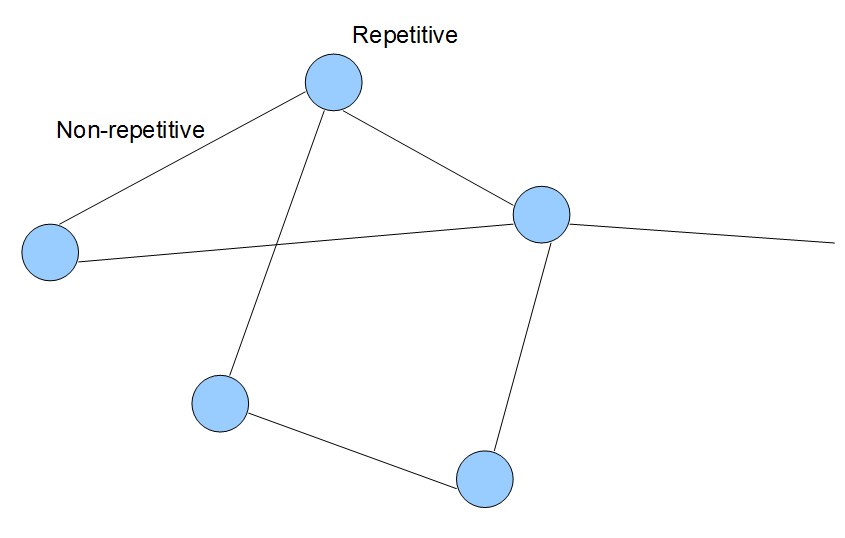
In general, most de Bruijn graphs constructed from short reads can go through one step of easy simplification. Conceptually, the larger topological structure of de Bruijn graph of genome constructed from short reads looks like the above figure, where each line and circle in the graph constitute of many k-mer-based nodes. Therefore, the graph can be simplified into contiguous regions and complex regions with many junctions between graph edges.