
Analysis of NGS miRNA Library - an Example
In a previous commentary, we covered the basics of sequencing miRNAs using NGS technology. There are subtle differences between reading a textbook on how to perform brain surgery and doing an actual brain surgery. Those differences are best explained by the following quote from Einstein -
In theory, theory and practice are the same. In practice, they are not.
Although analysis of miRNA data can do less harm than brain surgery, the general pattern of interrelationship between theory and experiment is the same. Real data do not like to abide by the rules set upon them by theory. Therefore, the theorists are expected to read the minds of experimental data.
We received data (99nt, single-ended) from a multiplexed miRNA experiment on seven tissues of a vertebrate. Illumina HiSeq instrument was used for sequencing. When we received the libraries, the reads were already split into 7 groups by the sequencing instrument likely based on the variable part of the linker. We do not know the exact protocol used by software inside Illumina instrument to separate the reads.
In this commentary, we will go through one of those seven libraries and see what the reads consist of. The discussions will be limited to the sequencing aspects of the libraries and not biological aspects, because the experiment has not been published yet.
The library we consider for our discussion was from tissue ‘H’ and had 13,332,197 reads. The linker for the tissue was ‘GGAATTCTCGGGTGCCAAGGAACTCCAGTCACACAGTGATCTCGTATGCCGTCTTCTGCTTGAAAAAAA’ with tissue-specific part marked in red. When all sequences in the library were searched for exact match with the linker, only 4379995 (33%) matches were found. Two thirds of the reads were lost. Eeeeks !!
Experienced bioinformaticians will immediately point out that searching for only exact match with the linker makes no sense, because sequencing errors are omnipresent in NGS data. We broadened our search to allow errors in up to two nucleotide positions of the linkers, and found 5,261,954 (39%) matches. 61% of reads were still unaccounted for.
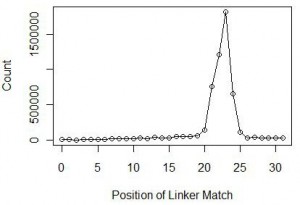
At this point, we also checked the nucleotide positions within reads, where the linker matched. Theory says that the position would roughly be around 22-23 nucleotide, which is the typical size of miRNAs in animals. Indeed we found over 84% of reads to have matches at 21-24 nucleotides with the peak at 23 nucleotides. The distribution is shown below.
We chopped off the linkers from all reads with matches at 23 nucleotide and ran a statistic for the 23mers. The 23mer with highest frequency was let-7, one of the earliest discovered miRNA. Let-7 was found in all animals from acoelomata tapeworms to mammals and is also highly abundant.
Our data made sense so far, except for the inconvenient fact 60% of reads were discarded. What do they code for? We will explore that in a minute.
One hypothesis is that the remaining reads contain more miRNAs, but our analysis did not capture them because those reads had more sequencing errors than two. We investigated that point next, but in a slightly different fashion than barely increasing the number of errors from 2 to 3, 4, 5, etc.
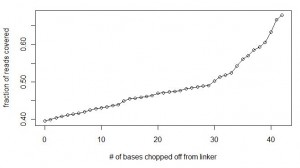
We continued to match the linker in all reads with allowance for two mismatches, but in each consecutive run, one base was chopped off from the end of the linker. So, the searches were done with ‘GGAATTCTCGGGTGCCAAGGAACTCCAGTCACACAGTGATCTCGTATGCCGTCTTCTGCTTGAAAAAA’, ‘GGAATTCTCGGGTGCCAAGGAACTCCAGTCACACAGTGATCTCGTATGCCGTCTTCTGCTTGAAAAA’, ‘GGAATTCTCGGGTGCCAAGGAACTCCAGTCACACAGTGATCTCGTATGCCGTCTTCTGCTTGAAAA’ and so on. The calculations were done until ‘GGAATTCTCGGGTGCCAAGGAACTCCAG’, which chopped off all variable bases from the linker and even more. Here is a chart of fraction of reads that could be accounted for with each extra base being removed from the end of the linker. It shows that after removing all bases of the linker up to variable part and four additional bases, 69% of the reads could be accounted for.
Did that prove our hypothesis that elevated level of sequencing error was the reason so many reads were missing from our first calculation? No, as will be clear from the next chart.
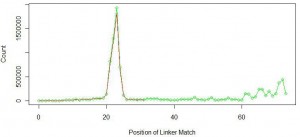
Red line in the above figure is the same as the first figure at the top of the commentary. Green like shows similar distribution of linker position for linker with sequence ‘GGAATTCTCGGGTGCCAAGGAACTCCAG’. You can see that not too many miRNAs were added at the primary peak near 22-23nt. Instead, new peaks started to form at nucleotide position 60 and above.
What is going on? You can understand by thinking about the wet lab part of the experiment. Typically miRNAs are filtered by taking the part of the gel that contains all short RNAs. We assumed that the sample contained only 22-23 nt miRNAs, but it also included other small RNAs of sizes around 60 nucleotides or more. When the 70 nt long linker attached to 60 nt long small RNA, total length of the sequence was 130 nt, and the sequencing instrument returned its first 100 bases with fragment of the linker attached at the end. We further checked the remaining 31% of the reads and found them to contain longer small RNAs. A fraction of them coded for ribosomal RNA.
The above calculation also suggests that if a researcher is interested in only miRNAs, he can safely discard 60% of the reads and continue his analysis with those 40% of reads containing miRNA and full linker.