
How do sequencing errors affect de Bruijn graphs?
Today’s commentary is the fourth in our de Bruijn graph series, but I did not like Roman characters to pile up in names as in Rocky movies (‘de Bruijn graphs
- IV’, ‘V’, ‘Balboa’) and instead chose a more descriptive title. For your convenience, our earlier discussions are linked here -
So far we stayed away from sequencing errors to keep the conceptual picture simple. However, anyone living in the real world of sequence analysis knows this - “In this world nothing can be said to be certain, except death, taxes and sequencing errors.” Therefore, today we investigate how errors can modify de Bruijn graphs.
We start with our original ‘genome’ sequence and its 7-mer de Bruijn graph as derived here.
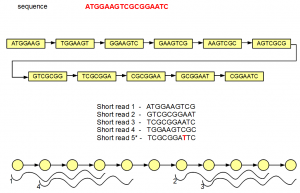
In the above figure, the de Bruijn graph has 11 nodes connected by edges. Let us assume that this very short ‘genome’ is sequenced by 10 nt short reads. Five such short reads are shown in the above figure, among which four are perfect, but the fifth has single nucleotide error (marked in red).
For convenience, we redrew the de Bruijn graph using circles and arrows at the bottom of the above figure. You can count 11 circle matching 11 nodes of the de Bruijn graph. Seven-mers within the nodes are not explicitly displayed. Four short reads matching the genome also align fully with the de Bruijn graph, and they are shown in the above figure.
The fifth short read does not align with the de Bruijn graph of the genome except for one node. Therefore, additional nodes need to be created to fully incorporate the erroneous short read. Those additional nodes are shown in gray below -
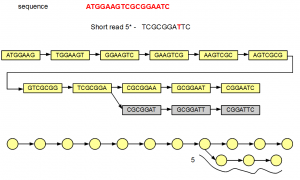
At the bottom, we have redrawn the simplified de Bruijn graph displaying alignment of the fifth read.
In the above example, the genome and its de Bruijn graph were known beforehand. So, it was easy to tell, which branch represented the erroneous read. In an assembly problem, the de Bruijn graph is first constructed from the short reads, and then the genome is derived from the de Bruijn graph. How is it possible to find out the wrong branch?
Let’s think conceptually about the construction of a de Bruijn graph from thousands of short reads, some erroneous, sequenced from the genome. The vast majority of reads match the genome perfectly. They will create many overlapping paths matching de Bruijn graph of the genome. Few erroneous reads will create extra branches that are not heavily traversed. As a result, a de Bruijn graph constructed from many reads will look like this -
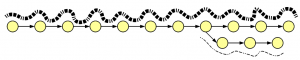
Heavy lines in the above figure represent overlaps of many reads, whereas thin lines show few reads likely generated from errors. Therefore, assembly algorithms prune thinly traversed paths of de Bruijn graph, and then reconstruct the genome from the heavily traversed paths.
In the example for error shown above, the erroneous read formed a branch going off the original de Bruijn graph. There is another possibility. Sometimes the reads are sufficiently long compared to k-mer size of de Bruijn graph and the error is in the middle. In such situations, the erroneous read may align with de Bruijn graph of the genome at both ends but differ in the middle, creating a loop pattern. Good short read assembly algorithms prune off both sparsely traversed branches and loops.
Previously we explained that the size of de Bruijn graph in an error-free world was limited by the size of the underlying genome, and did not change with depth of sequencing. That is not valid, when errors are present. Errors add new branches to the de Bruijn graph and thus increase the size of the graph. Therefore, more computer memory will be needed to load the de Bruijn graph. This additional requirement for memory will go up nearly linearly with the number of reads, because the number of errors increase linearly with read count.
Additional posts on this topic -
De Bruijn Graphs for Alternative Splicing and Repetitive Regions
A Drawback of de Bruijn Graph Approach
Using Mate Pair Information in de Bruijn Graphs
Do de Bruijn Assemblers Work in Color Space?