GEO and SRA - Quarterly Growth in Transcriptomic Research
We updated all charts in our trends section with the latest data current as of yesterday. We also added three new charts.
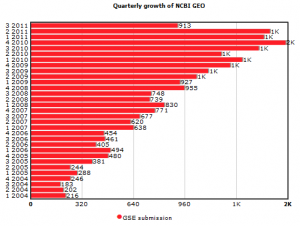
The first chart shows quarterly growth of transcriptomic research based on number of GSE submissions. You can see steady growth over the years, except for a brief spike in Q4, 2010. We will come to that later.
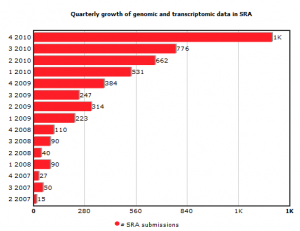
In the next chart, we show quarterly growth of SRA database, including both genomic and transcriptomic data sets, up to Q4 2010. The chart shows near exponential growth that possibly made people at NCBI panic and propose closure of SRA.
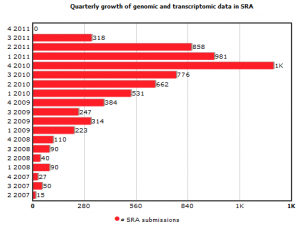
In the following chart, we present SRA up to yesterday. The exponential trend was an one-time spike in Q4 2010 that did not continue afterward. You may argue that the proposal of closure of SRA database discourage researchers from submitting their data. We suspect something else. It is more likely that the spike in Q4, 2010 was an artifact due to economic stimulus money given for research in USA. We say that, because the GEO database also showed similar spike in Q4, 2010.
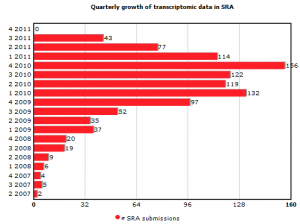
Before you argue that the spike in GEO database also came from NGS submission, here is the SRA trend for transcriptome datasets only. Three things to observe -
(i) a small spike was seen in Q4, 2010, but with only 34 additional submissions. That could not have created the large spike in GEO, and the bigger part of Q4, 2010 contributions in GEO likely came from array data.
(ii) In general SRA database did not grow very rapidly in 2010. This is possibly because most NGS algorithms for transcriptomics (Tophat, Cufflink, Oases, Trinity, etc.) are coming up over the last year.
(iii) We are seeing quite a bit of drop in SRA transcriptome submission from steady state of 2011. I suspect the SRA closure announcement discouraged researchers from submitting data.