March 2012 Update on GEO Trends (Countries)
For new readers, easiest way to follow us is through our twitter feed. The feed is updated, whenever we post a commentary here.
In our Trends section, we updated all GEO and SRA-related charts with the latest data. The previous data update was done during Aug-Sep 2011. In future, we expect to update data almost daily and post summary commentaries every six month or so.
In the next few commentaries, we would like to discuss our observations regarding change in global transcriptomics landscape. Please keep in mind that 2012 numbers in these charts are only for the first 2.5 months. Therefore, they need to be multiplied by a scaling factor of 5 to estimate yearly numbers.
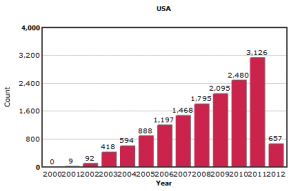
Let us first review the data for countries and cities. Here is the distribution for all countries -
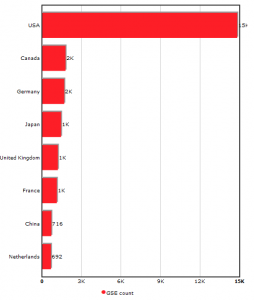
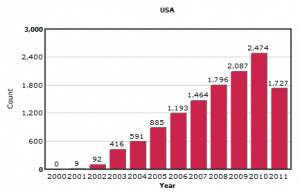
Corresponding chart from end of August 2011 is shown below.
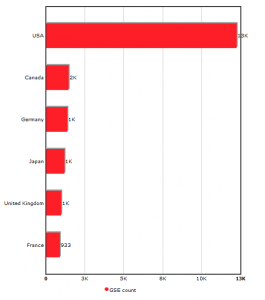
USA still remains the undisputed leader in global transcriptomics research and US numbers continue to grow by leaps and bounds. The numbers for other countries are difficult to read in the above chart, because the software rounds them up to nearest 1K. The following charts will give better numbers for different countries.
One point of caution in interpreting the above charts - we noticed that some European experiments get submitted only to Array express at EBI and not to NCBI GEO. We are looking into those numbers to find out how much discrepancy is caused by such preference in submission, and the information will be presented in a later commentary. Nevertheless, trends for individual countries, as shown in the following charts, should be less biased by submission preferences.
USA (15th March, 2012) -
USA (end of August, 2011) -
Two things to note -
(i) The last four months’ submissions in 2011 (1400) came out to be comparable to the first 8 months (1727), and took the final 2011 tally to way over 2010. Other countries showed similar patterns.
(ii) 2012 is on a healthy start with 657 submissions in the first 2.5 months (3300 annualized).
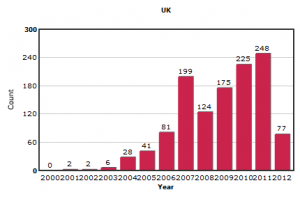
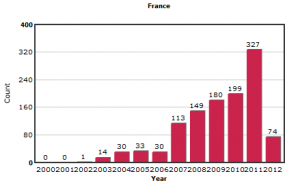
Among other countries, UK is showing phenomenal growth during early 2012. (The 2007 peak in the following chart is an artifact that came from submission of large number of Arabidopsis measurements from one publication).
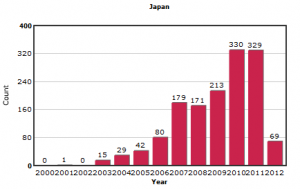
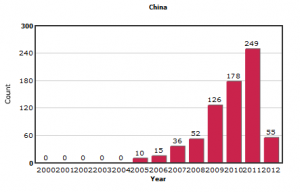
Japan is also appearing strong, and France and China are reporting transcriptomic measurements at rates comparable to last year.
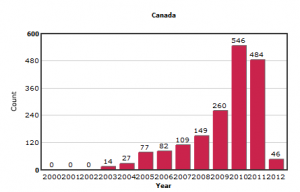
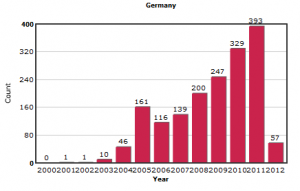
On the other hand, Germany and Canada are showing dismal figures in early
- Especially, Canada will go back to lower numbers of 2009 after having two strong years in 2010 and 2011, if the same trends continue.