
A Question on de Bruijn Graphs of Transcriptomes (RNA-seq)
Reader Ken asked in an earlier commentary -
Great educational resource!
Would you be able to provide an explanation about low-complexity k-mer effects on de-bruijn assembly?
For example, Illumina RNA-seq reads have a 5? sequence bias. What happens if this is of very high coverage and one does not trim it off?
Hello Ken,
Thank you for the excellent question. It is more complex than you possibly intended it to be, because RNA-seq introduces another layer of complication due to various genes being present in the sample at widely different expression levels. Let us try to answer your question by presenting various ‘conceptual blocks’.
Conceptual block 1. Genome is uniform, but transcriptome is non-uniform
Think about the starting material for both genome sequencing and transcriptome sequencing. In case of genome sequencing, you start with chromosomes from a number of cells. So, ideally you should have identical number of each chromosome. In a shotgun sequencing method, those chromosomes are sheared into millions of small pieces and each small piece is sequenced by the NGS instrument.
The starting material for RNA-seq is the expressed gene pool. Gene A may be present 1000 times more than gene B in the sample, even though the chromosomes have equal number of copies of genes A and B. It is because the counts of various genes in the RNA-seq sample are proportional to their expression levels.
Conceptual block 2. Genome is far more repetitive than the transcriptome
The issue of assembling low-complexity region is lot more important for genome assembly than transcriptome assembly, because the genome consists of a long stretches of nucleotides (could be 100 million base pair for mammalian genomes) with repetitive and non-repetitive blocks interspersed with each other. Genes are only 1 or 2Kb long, and rarely have repeats. Low complexity regions mostly consist of poly-A tails at the 3’ ends.
Conceptual block 3. de Bruijn graph of a genome
In an earlier commentary, we showed what the de Bruijn graphs genomes look like in terms of k-mers. Usually, a large mammalian genome will have billions of such k-mers. The graph can be simplified, and forms a topological structure like the following.
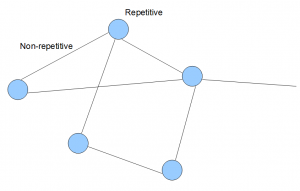
In the above image, each line and circle is an aggregation of many k-mers. Typically, k-mers from non-repetitive regions of a genome join to form lines as shown in the above image. K-mers from repetitive regions are not easy to simplify, and are shown as circles as blobs of many such k-mers.
Conceptual block 4. K-mer distribution of reads from a genomic library
We borrow the figure from an earlier commentary.
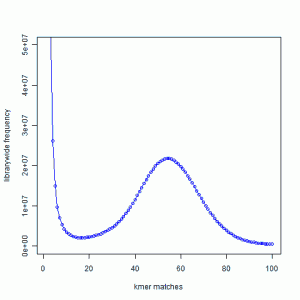
You can see that k-mer distribution of reads from a genomic library typically has a peak in the middle (k=~55 in the figure). The k-mers around the peak come from the non-repetitive regions of the genome. The k-mers from the large peak near k=1 represent sequencing errors, and the k-mers from k much greater than 70 come from repeats. Please read the earlier commentary for an explanation.
Conceptual block 5. de Bruijn graph of a transcriptome
We borrow the following image from an earlier commentary.
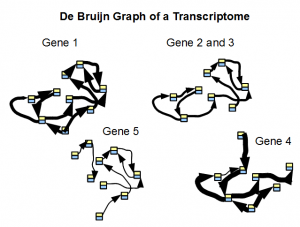
De bruijn graph of a transcriptome is simpler than de Bruijn graph of a genome, because ideally each block shown in the above picture can be simplified into one gene. However, you cannot use k-mer statistics for finding simple regions, because each unit has different expression level and therefore different k-mer count. We presented k-mer distribution of one of our RNA-seq samples in this commentary, and as you can see, the distribution does not have any peak like the one for genome.
-——————
With those conceptual blocks, we can try to answer your question.
Typical genome assemblers set aside low-complexity k-mers and try to assemble long, contiguous regions first. Then they try to resolve low-complexity regions based of mate-pair data. It is a very difficult problem, and you may take a look at SPAdes papers covered in our blog to learn more.
Transcriptome assemblers do not need to worry much about low-complexity regions, because the genes rarely contain repeats, and the genes are short by themselves. Transcriptome assemblers do have other concerns however arising from non-uniform expression levels of genes, and alternatively spliced genes.
If you want to make your life harder, please look at metagenomes. Metagenomes combine the complications of both genome assemblers and transcriptome assemblers.