
X-Rank Algorithm for Analyzing LC-MS/MS Peaks
We received a request for explaining the X-rank algorithm used to analyzed LC- MS/MS peaks. We will start with a brief introduction to the experimental method, then explain the X-rank algorithm and finally compare it with other existing algorithms.
Chromatography, LC and HPLC
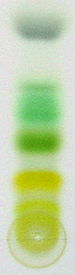
Chromatography originated in 1900, when Russian scientist Mikhail Tsvet used gravitational pull to separate plant pigments chlorophyll, carotenes, and xanthophylls, and showed them to form bands of different colors.
Over the years, the methods for both separation and ‘color detection’ improved dramatically. Modern HPLC (high- pressure/performance liquid chromatography) machines use pressurized pumps to accelerate the process of separation instead of relying on gravity. X-rank algorithm being discussed below is more related to the ‘color detection’ process than the separation procedure.
Mass Spectroscopy
The method of identifying chemicals by their colors is very limited, because a large number of compounds are colorless. Mass spectroscopy emerged as a better approach, because it partitioned compounds based on their molecular weights, or rather the molecular weight to charge ratio. When a chemical mixture goes through a mass spectrometer, the instrument gives out a number of peaks of different heights and locations (m/z).
For our discussion, we can ignore what the peaks really represent and consider them as equivalent to bands of different colors (x-axis) with different intensities (y-axis).
The mass spectrometry methods received substantial improvements in early 1990s, when tandem mass spectroscopy (MS/MS) was introduced. Tandem mass spectrometers allow multiple stages of mass spectroscopy with the first stage analyzing an entire mixture, and the subsequent stages looking at parts of the spectrum with finer resolution. A good introduction to tandem mass spectroscopy is available here. Also check ‘an introduction to mass spectroscopy’.
X-Rank Algorithm
Typically, a researcher analyzing mass-spectroscopy samples get an image from the instrument containing number of peaks. Those peaks correspond to various fragments of one or more compounds. His goal is to find what the sample contains, and a good way to do that is to compare the peaks generated by the instrument with peaks of various standard samples. The comparison used to be done manually in the earlier days, but with the volume of data being generated by modern machines, an automated method is necessary.
X-Rank: a robust algorithm for small molecule identification using tandem mass spectrometry
We introduce here a new algorithm that successfully matches MS/MS spectra generated by a range of instruments, acquired under different conditions. Our algorithm called X-Rank first sorts peak intensities of a spectrum and second establishes a correlation between two sorted spectra. X-Rank then computes the probability that a rank from an experimental spectrum matches a rank from a reference library spectrum.
The algorithm is actually very simple. To understand how it works, let us consider a simple analogy. Suppose, someone wants to write a computer program to find matching shirts. His program is expected to process an image of a shirt and find out whether it matches any of a set of shirts in his ‘standards library’. The first step of his algorithm identifies all colors in a shirt and shows them on a chart with the intensities. A white shirt with few blue dots will have a large peak for white and small peak for blue. A blue shirt with few white dots will have a large peak for blue and small peak for white.

A computer algorithm for matching two sets of peaks, as shown in above image, will need to compare the peak locations (colors) and peak heights. Such a comparison would be easy, if all peaks were always available and their heights were proportional for identical shirts. To make life interesting, we also assume that the images are somewhat noisy and blurry. So, there may be additional noisy peaks, and some real peaks may be missing as well.
X-rank does the comparison elegantly by avoiding reference to actual intensities and instead by ranking the peaks in the order of their heights. In the above example, a white shirt with small blue dots will have a large white peak and small blue peak. When compared to another shirt of this similar nature (large white peak and small blue peak), X-rank will generate a high score. However, if the image is compared with a different image that has large blue peak and small white peak, X-rank will give a lower score.
The comparison is done in the following manner. For each peak in the experimental image, X-rank finds out the ranking order of similar peak in the reference and computes a probability score.
1. White peak - highest in experimental image and second highest in reference
- What is the log(p) value?
2. Blue peak - second highest in experiment image and highest in reference - What is the log(p) value?
3. Pink peak - third highest in experimental image and absent in reference - What is the log(p) value?
By summing up the probability values, X-rank computes the probability of two images being identical.
How to compute the probability score?
All the ‘ugly details’ are hidden in the method of computing various probability scores. We would request readers to read pages 62-71 of thesis linked here, and especially pay attention to figures 2.12 and 2.13. Very briefly, the authors asked question of this nature - ‘given the peak in sample matches (does not match) peak in reference, what is the probability than sample and reference are identical?’ Three lines in Fig. 2.13(a) show the probability distributions for top ranking peak in sample matching peaks of various ranks in reference. The authors chose ‘Gamma like’ distribution and then estimated various parameters of the distribution from empirical data. Page 67-68 of the thesis have all details.
Comparison with other Algorithms
Thesis linked above presents some information on comparison with competing models. Among those, ramp is a new algorithm, whereas dot product is old.
On comparison with ramp
Until now there is no direct comparison of the ramp algorithm towards other ones. We had an informal discussion with Innsbruck University Hospital to compare their algorithm towards our own X-Rank. Currently, results are not complete enough to be presented here. However, using the right parameters, the ramp algorithm seems to perform very well. The results presented in their publications are done on laboratory data only accessible by themselves. Since the algorithm needs parameter optimizations on training data, it is difficult to reproduce them properly. Unfortunately, there is no possibility of using this software, which consists in perl scripts, but it is currently used in house at the Innsbruck University Hospital.
On comparison with dot-product and SharePeakCount
The X-Rank algorithm clearly outperforms the other two algorithms. The SharePeakCount algorithm shows very poor performance, not surprisingly, since it only takes into account fragment masses. The dot product implementation shows better results but has a very high false positive rate. If we accept to get only 50% of the possible true identifications we still got a false positive rate of 3%. This is hardly acceptable for any identification platform.
-———————————-
Readers may also take a look at the following thesis -
Computational Analysis of LC-MS/MS Data for Metabolite Identification