
A tutorial on KMC tools
The new version of kmc includes a number of really cool utilities. You need to run the executable ‘kmc_tools’ to access them. Let us demonstrate some uses.
There are four options with kmc_tools.
| Command | Use |
|---|---|
| 1. kmc_tools transform | Converts a kmer db to something else (e.g. histogram) |
| 2. kmc_tools simple | Adds or subtracts two kmer databases |
| 3. kmc_tools filter | Filters reads based on ‘unacceptable’ kmers |
| 4. kmc_tools complex | Complex processing based on commands in a file |
Before we go through the tutorial to show the usefulness of kmc_tools, we like to demonstrate something developed by us. As you all know, a major problems in bioinformatics in trying out new programs is to get all ducks lined up to even be at the starting point. For example, installation may fail for many researchers, because they are on Mac or Windows. Some others may not have the right data files in right format to try the program. Finally, the hurdle of deciphering the manual (if it at all exists) of the new program is always there.
To make the process really really simple, we are creating server accounts for our members and installing the necessary programs and data. With those steps taken care of, trying a new program is a breeze.
For those with account, please log into the assembly server. Replace [user_id] with your user ID.
ssh -p 2230 [user_id]@coding4medicine.com
You will find the latest kmc and kmc_tools, as well as R installed in your account. Also, you can access a set of fastq files in the ‘/share/data’ directory to try ‘kmc’. If you are trying this tutorial on your own, please install kmc, kmc_dump, kmc_tools and R.
Kmc requires a temporary directory to run. Therefore, let us create one with the name ‘tmp’.
mkdir tmp
Next we run kmc on two E. coli files in the /share/data/D-ecoli-10K-ilmn directory. Those trying the program yourself can pick any two fastq files.
Let us explain the syntax of the following command.
- The part ‘-m1’ means using no more than 1GB RAM.
- The part ‘/share/data/D-ecoli-10K-ilmn/z1.fastq’ is the input file in FASTQ format. Please note that kmc can read gzip files as well.
- The next word (‘out1’ or ‘out2’) is the name of the output database.
- The final word (‘tmp’) is where the temporary files are stored. It is cleaned after kmc completes execution.
kmc -m1 /share/data/D-ecoli-10K-ilmn/z1.fastq out1 tmp
kmc -m1 /share/data/D-ecoli-10K-ilmn/z2.fastq out2 tmp
After you run the above two commands, you will see the files ‘out1.kmc_pre’, ‘out1.kmc_suf’, ‘out2.kmc_pre’, ‘out2.kmc_suf’ in your directory.
Let us now run ‘kmc_tools simple’. It operates on two databases (e.g. out1 and out2) and finds the common kmers. We are using ‘intersect’ option below, but please note that the users can also use ‘union’, ‘kmers_subtract’, ‘counters_subtract’, ‘reverse_kmers_subtract’ and ‘reverse_counters_subtract’. After you run the following command, you will see additional files ‘out_ins.kmc_pre’ and ‘out_ins.kmc_suf’ in your directory.
kmc_tools simple out1 out2 intersect out_ins
We can draw the histogram of kmers in the out1, out2 or out_ins database by using ‘kmc_tools transform’. The following command generates the file ‘hist.txt’ with historgram numbers.
kmc_tools transform out_ins histogram hist.txt
To visualize the histogram, you need to run R. In your account, please go to the R directory and type ‘R’. Inside R, load the file ‘hist.txt’ with the following command.
mydata=read.table("../hist.txt", row.names = 1)
The following command is now used to plot the histogram. If you are using your own machine, use ‘qplot’ instead of ‘myqplot’. The command ‘myqplot’ is explained here.
myqplot(V1,V2,data=mydata, geom="line")
If you go to the link “http://coding4medicine.com:2130/[user_id]/plot.png” (replace user_id with your user ID), you will see the following chart.
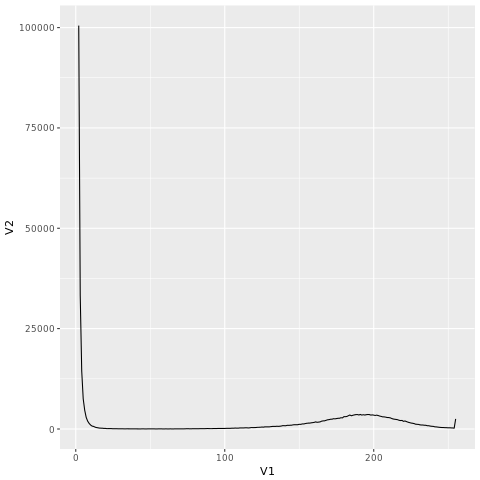
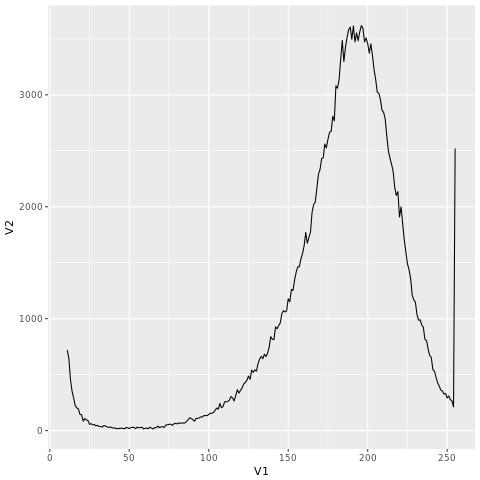
The figure is dominated by kmers with low count. Let us remove them from the histogram using R.
mydata2=mydata[10:254,]
myqplot(V1,V2,data=mydata2, geom="line")
If you go to the link “http://coding4medicine.com:2130/[user_id]/plot.png” again (replace user_id with your user ID), you will see the following chart.
We will give more examples on kmc_tools in tomorrow’s post.