
De Bruijn graphs - I
New algorithms for short read assembly (categories B and D) often use de Bruijn graphs to store and represent sequence data. What is a de Bruijn graph and why is it so popular for analyzing short read sequences? We will explain the concept here.
De Bruijn graph is an efficient way to represent a sequence in terms of its k-mer components. Although de Bruijn graphs can be used for a broad range of problems, our discussion will be limited to nucleotide sequences. Most papers talk about constructing de Bruijn graphs from short reads and derive the genome sequence from the de Bruijn graph. For simplicity, here we will first introduce de Bruijn graph of a genome, and then explain how short reads fit into the picture.
A de Bruijn graph can be constructed for any sequence, short or long. Here is a simple example -
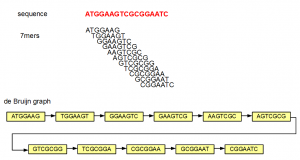
In the above example, the sequence ATGGAAGTCGCGGAATC is split into overlapping K-mers (K=7), and a directed graph is constructed with those 7-mers as nodes. Edges are drawn between 7-mers adjacent on the original sequence. This method of construction also ensures that connected nodes have overlaps of 6 (=K-1) nucleotides.
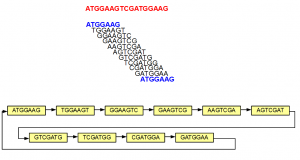
The above example is simple, because none of the 7-mers repeated within the original sequence. In the next example, we introduce some repetition. The 5’-most 7-mer in this example is identical to the 3’-most 7-mer (both marked in blue). The de Bruijn graph forms a loop in this case.
Although the nodes displayed in the above examples did not show sequences for both strands, in reality, each node is double-stranded as shown below -
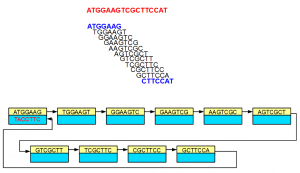
In the above example, 3’-most 7-mer is the reverse complement of the 5’-most 7-mer. The links in the double-stranded de Bruijn graph were constructed accordingly.
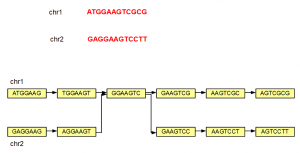
The steps shown above can be repeated to construct de Bruijn graph of a large genome of any size. We note that even if a genome has 2 separate chromosomes, the de Bruijn graphs may not remain separate, if those chromosomes have overlapping K-mers as shown below.
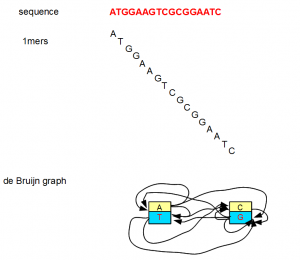
All of the above examples considered K=7, but K can be any small or big integer. At its lowest extreme, K can be 1. However, a K=1 de Bruijn graph is not very useful as you can see from the following figure.
The above discussion introduces de Bruijn graphs for our purpose. Why they are so popular for genome assembly programs will be explained in the following post. Before closing, we will note few more points about de Bruijn graphs that will be helpful in our future discussions.
1. Given any sequence and K-mer size, we can create a de Bruijn graph in an unique manner.
2. The other direction is not true. Any de Bruijn graph cannot be resolved into an unique sequence. Unless the de Bruijn graph is in its simplest form, it usually resolves into many possible sequences.
3. Larger the K-mers, more easy it is to convert the de Bruijn graph into an unique sequence.
4. Higher K-mer size generally requires more computer memory to store and process the graph. Therefore, how much RAM a machine has sets the upper limit for value of K.
Additional posts on the same topic -
How do sequencing errors affect de Bruijn graphs?
De Bruijn Graphs for Alternative Splicing and Repetitive Regions
A Drawback of de Bruijn Graph Approach