
From Multiple Kmers to Multi-kmer de Bruijn Graph
Which k-mer size to choose for NGS assembly has always been a difficult question to answer. In the earlier days, researchers did not have to scan for too many k-mers, because the assemblers capped MAX_KMER to 31 to reduce memory usage, and the reads were short anyway. With longer reads and memory-efficient assemblers, the question of finding optimal k-mer is becoming more and more important.
To understand why k-mer question is important, you need to first look at how de Bruijn graph-based genome assemblers work (here, here, here). They assemble short reads by breaking them into even shorter pieces, forming a giant graph and merging together the ‘simple’ regions of the graph.
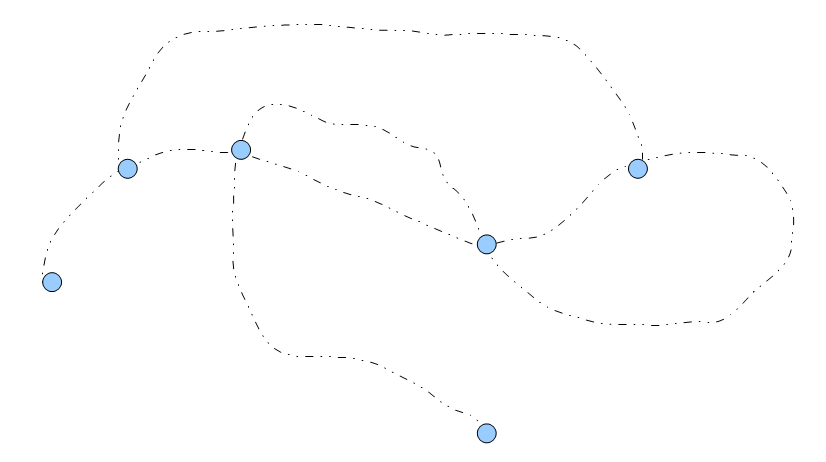
The above image shows part of a de Bruijn graph for a genome. The black dotted lines consist of many k-mers, but each k-mer has only one left neighbor and one right neighbor. Those parts of de Bruijn graph are each to combine (assemble). On the other hand, at each branching node (blue circle), the program needs to make a decision about which path to take. The assembled sequence differs based on which way the algorithm picks.
What happens, if we pick very small k?
To conceptually grasp the significance of choosing the right k-mer, let us start with very small k-mers (1, 3, etc.) and increase the size. We showed the de Buijn graph for k=1 in our earliest commentary.
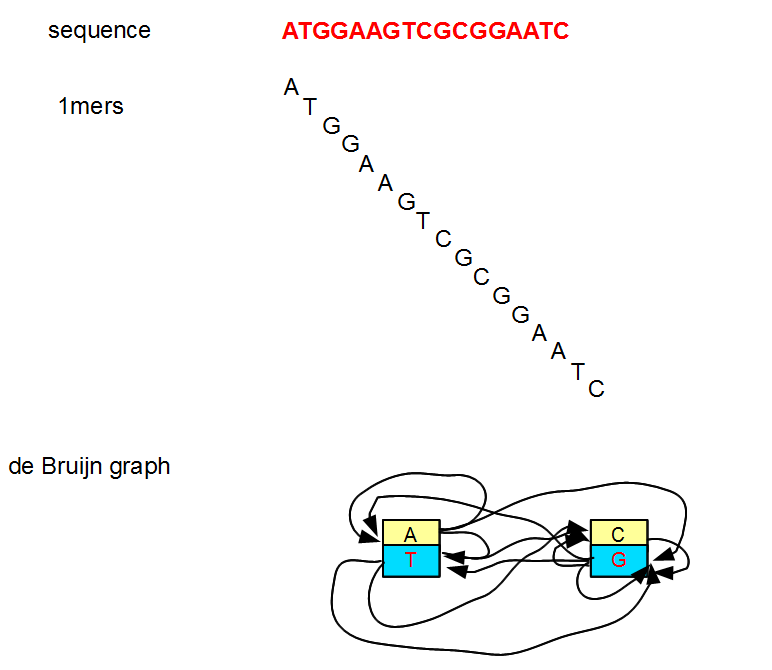
That de Bruijn graph is not very useful, because it has only two nodes and both nodes have many edges. The graph has no simple region to assemble.
If we raise k to 3, the number of potential nodes will increase from 2 to 32 (AAA, AAC, AAG, AAT, ACA, ACC, ACG, ACT, AGA, AGC, AGG, ATA, ATC, ATG, CAA, CAC, CAG, CCA, CCC, CCG, CGA, CGC, CTA, CTC, GAA, GAC, GCA, GCC, GGA, GTA, TAA, TCA), but the de Bruijn graph will continue to look like noodle soup.
Only when we make k large enough, the de Bruijn graph starts to show linear paths as in the first figure above. How do we know, whether the k we picked is large enough? The answer depends on the size of genome or genomic region being assembled. The number of potential nodes in the de Bruijn graph increases with k as (4^k/2), and it needs to be comparable to the size of genome for few distinct k-mers to show up. With k=17, total number of distinct nodes in the de Bruijn graph is 8B. So, k=17 is good enough to start assembling human genome.
In reality, you will not be able to assemble human genome with k=17, because genomic sequences do not constitute of randomly distributed nucleotides, but they have distinct repetitive patterns. Repeat regions of human genome will continue to look like noodle soup with k=17. For details, please check Ruiqiang Li’s 2010 paper on human genome that has nice description on the k-mer distribution of human genome in repetitive regions.
Why not pick a very large k-mer then?
My son is learning to count. When I asked him to choose a very, very large number and he picked 123. So, let us start with k=123 and see what happens. Oops, we have a problem, because 123 is bigger than our Illumina read sizes (100 nt) and we cannot get any k-mer. The biggest k-mer we can choose is restrained by the read size, but can we even go that far to get meaningful assembly?
In the following figures, we show the statistics for an assembly for a ~700Mb genome we are currently running with different k-values. The calculations are done with Minia and we show data for contigs only.
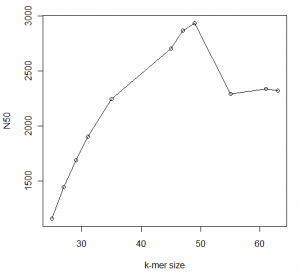
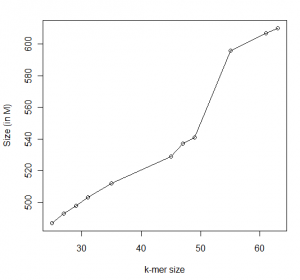
You can see that N50 peaks at around 49, which happens to half of read size. Beyond that, N50 deteriorates but our assembly continues to get larger. What is going on?
You are seeing two effects. Firstly, more and more segments are being assembled with larger k-mer, because large k-mer size can distinguish between slightly different small repeats that small k-mer size cannot. On the other hand, the de Bruijn graph is getting more and more fragmented with large k-mer size. As an extreme case, if k-mer size is equal to read length, each unique read will be a node in the de Bruijn graph unconnected to any other node.
What is the solution? In the Jurassic age of NGS analysis, researchers ran Velvet for all possible k-mers and picked the assembly with best N50. That is suboptimal, as we explain below.
Why does the assembly improve with higher k-mer size?
Let us borrow a figure from our earlier commentary titled An Intuitive Reason for Running Velvet with Multiple K-mer.
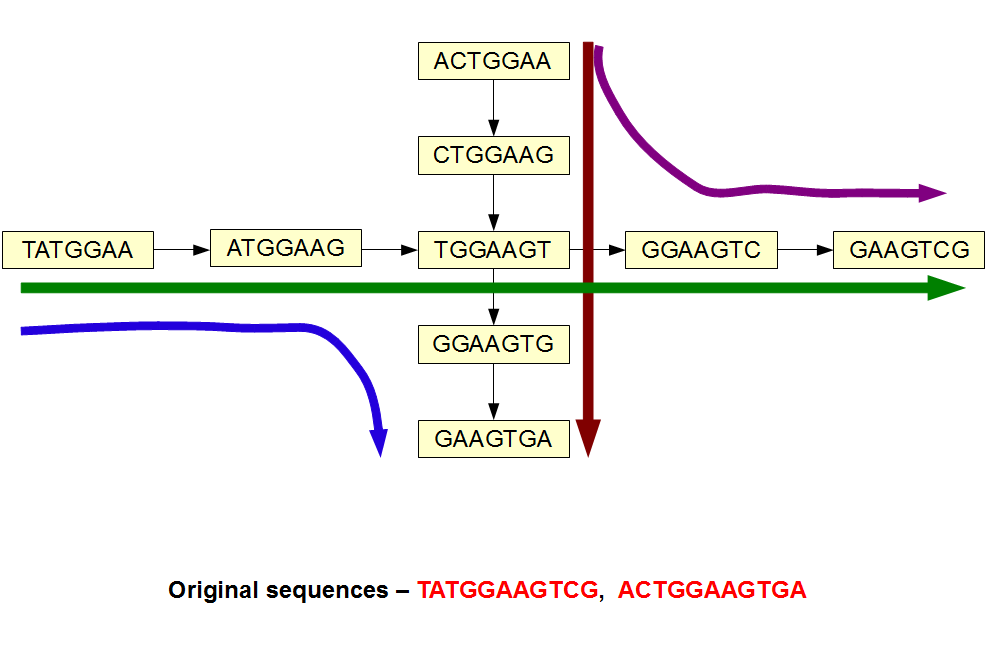
In the above image, the original sequences are shown at the bottom. The de Bruijn graph constructed with k=7 has a branching k-mer. So, it is possible to assemble the de Bruijn graph with 4 possible paths, even though the original reads had only two possibilities. So, two extra paths are artifacts of de Bruijn graph not supported by our reads. Those artifacts will go away, if we simply raise the k-mer size from 7 to 9. Two paths will separate away and we will get our original reads back.
The above process is going on at many different nodes, when we increased k-mer from 25 to 63 in the example of ~700 Mb genome presented earlier. Even when the increase of k from 61 to 63 is likely to resolve few ambiguities, although the overall N50 does not increase.
The above process is unrelated to the deterioration of N50 due to fragmentation of other regions of genome previously assembled with lower k-value. Different parts of the genome have different distribution of reads, and some assemble better with low k-mer value and some assemble better with high k-mer value.
How can we have our cake and eat it too? The answer is not to rely on one single k-mer, but instead use the good answer from all k-mers. There are various ways to do that.
Titus Brown Solution
In his blog, CTB presented one way to assemble with many k-mers.
Merging Velvet multi-k assemblies
Patrick Chains group at LANL has developed an approach to merge regular Velvet assemblies with multiple ks using a program called minimus2. Lets try it out!
Essentially, he runs Velvet for many different k-mer values, uses cd-hit to cluster the assemblies and then applies minimus2 to merge them all.
IDBA Solution
IDBA papers here and here use more sophisticated approach by starting with small k-mer and removing the reads that already assembled and moving to higher k-mer with remaining reads. From their paper:
We propose a new assembly algorithm (IDBA) based on the de Bruijn graph. The idea is simple but practical in that it alleviates the difficulties in setting a correct k and the filtering threshold m, gives good results, uses much less memory (many existing tools require huge amount of memory making them impractical for large genomes) at the expense of a reasonable increase in running time. Instead of using a fixed k, our algorithm iterates from small to large k (kmin to kmax) capturing the merits of all values in between. The key step is to maintain an accumulated de Bruijn graph to carry useful information forward as k increases. Note that this is not the same as running the algorithm for many different k values independently as it is not clear how to combine contigs from different runs to get a better result. We show theoretically that the accumulated de Bruijn graph can capture good contigs and these contigs can be made longer as k increases. Based on experiments on simulated and real data, we show that IDBA can produce longer contigs (see Table 2 for the N50 comparison) with similar accuracy (very few wrong contigs and high coverage). More detailed results are presented in Section 4.
We are able to reduce the memory consumption by 50-80% as compared to existing algorithms which use a fixed k of moderate size. Because k is of moderate size, the algorithms cannot do filtering in the first step especially when the coverage is not high and thus create a big graph due to false positive vertices. However, since IDBA starts with a small k, many false positive vertices are pruned with a conservative and effective filtering in the first step (e.g., set m=1). Although IDBA iterates through different k values, with implementation tricks (described in Section 2), IDBA runs a lot faster than Abyss and is comparable with other existing algorithms.
SPAdes Solution
SPAdes paper (here and here) proposes a multi-kmer de Bruijn graph. Borrowing Fig.2 of their manuscript -
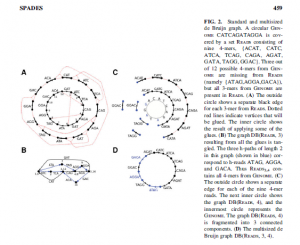
We do not yet understand the details of their construction of multi-kmer de Bruijn graph, but it seems to be an innovative way to deal with the k-mer issue.
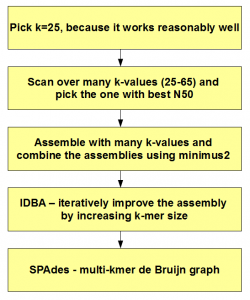
In summary, here is how to pick k-mer for assembly
-———————————–
A very useful comment from C. Titus Brown -

To understand the difference between k-mer distribution in a genome and a transcriptome, please check these two commentaries.
Maximizing Utility of Available RAMs in K-mer World
K-mer Distribution of a Transcriptome
Please note that the k-mer distribution in the above commentaries is used simply to estimate read coverages. All calculations were done with k=21.