
Philip Ashton: Assessment of Assembly
Philip Ashton (@flashton2003 in Twitter) is in the first few months of his first post-doc as a bioinformatician at Public Health England, and is starting to write at Bits and Bugs blog. He forwarded us an informative blog post on assessing assembly, where he shows that using N50 as a sole metric can create too many misassemblies, but give ‘better assembly’. Incidentally, we came to similar realization last year, while using Velvet for our bootstrapped genome assembly (What is Wrong with N50? How can we make it better?, What is Wrong with N50? How can we make it better? part II). When we compared k-mer distribution of assembly with k-mer distribution of reads, we found some k-mers supposed to be present only once in the genome to be present 7-8 times. That led us to switch to Minia/SOAPdenovo.
-————————————
Cross-posted partly from Philip’s blog:
Assessment of Assembly
We, like many people, are interested in optimal de novo genome assembly. When you assemble a genome you want the best possible representation of the ‘true’ genome. How can we obtain the best possible representation?
In the past we have used VelvetOptimiser to do our assemblies. This assembles with a range of k-mers and returns the best assembly. This approach produces assemblies with high N50s, which is a handy rule of thumb for assembly quality.
However, like the old adage ‘as soon as a measure becomes a target, it ceases to be a valid measure’, we are wondering whether optimising for N50 in this way provides the ‘best’ assemblies.
So, we decided to assess a couple of different k-mer estimation tools, Kmer Genie and VelvetK, and see how assemblies with their K-mers stack up against VelvetOptimiser. The test sample was paired-end fastq data from a shiga toxin producing E. coli O157 I’m working on, representative of our samples in terms of coverage and quality.
The three different assemblies were then assessed with Quast, a reference (I used _E. coli _O157 Sakai) based assembly quality assessment tool.
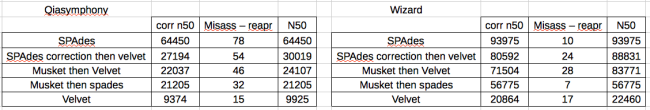
Table 1: Characteristics of the different k-mer estimation tools, calculated by Quast. Velvet Optimiser k-mer range was 21-121, to match the Kmer Genie range.
-———————————————-
Please continue to read the rest at his blog. He included several informative charts and script for you to play with.