
In our Trends Section
We updated the trends section with latest data.
The GEO database has been growing steadily, but we believe the large peak in Q4 of 2011 was an outlier.
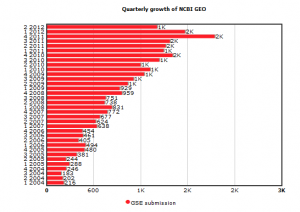
What could cause such an outlier? Although we do not have any concrete data to back this assertion, welfare spending on academics is likely to be the prime candidate. The grants were approved in later part of 2009 or early 2010, and based on typical time to do research, write papers and get them reviewed/accepted, it is quite reasonable to expect many ARRA papers to be published around late 2011.
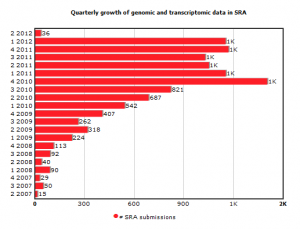
Speaking of SRA database, it is interesting to find that the exponential trend up to late 2010 that made NCBI panic into announcing shutdown of SRA did not continue or come back. One may say that the ‘measures taken by the government were effective in removing the backlog’ or one may say that NCBI panicked prematurely. Which point of view you choose depends on your color-coded political affiliation.
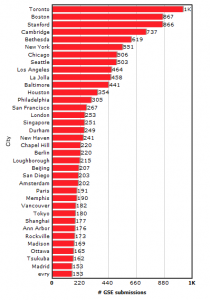
Among global hotbeds of transcriptomics, Stanford is no longer the leader and has been taken over by Toronto and Boston. Anyone, who tracked the data for individual cities over the years (presented here), should have expected the outcome. Is the shift related to cost of living around Stanford that made young and productive researchers move out to other cities? Or is it due to other universities catching up with the early success of Stanford with array technology?
You can find many other interesting charts at the trends section. In the next commentary, we will show how the interests of researchers has been shifting from traditional array experiments to next-generation technologies. Surprisingly, a technology other than high-throughput sequencing is making major inroads. Also, many researchers around the globe are showing interests in studying new mammal outside the traditional set of human, mouse and rat. Which one is it? Stay tuned to find out.