K-mer Distribution of a Transcriptome
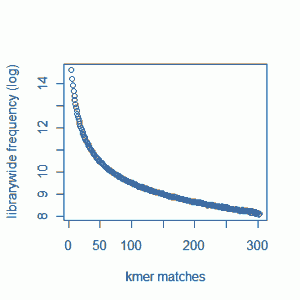
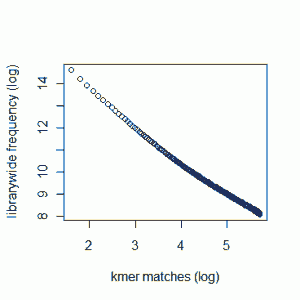
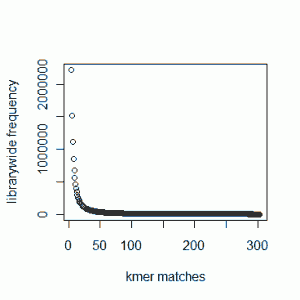
Our previous commentary - Maximizing Utility of Available RAMs in K-mer World presented the K-mer distribution of a Solexa genomic library, and showed a peak around 50 suggesting that short reads sampled the unique parts of the genome 50 times on average. Reader Rick Westerman asked how the distribution would look like for a transcriptome library. Here we present plots of K-mer distribution for a transcriptome (RNA-seq) library with 100 million reads of sizes 100 nucleotide each. Three plots below show the same data in linear-linear, linear-log and log-log scales.
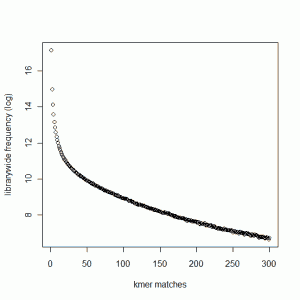
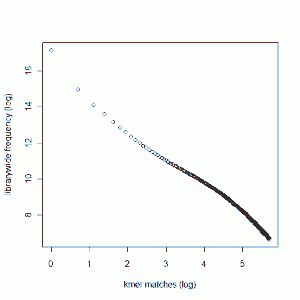
We do not see any peak like genomic data, because genes in a transcriptome have various expression levels.
One thing to note - we do not see peaks for some genomic data sets as well, because the sequencing coverage is so low that it gets hidden under the huge bump near x=0 (which is produced by sequencing error). To make sure that is not the case for the transcriptome plot shown above, we are repeating the calculation with 7 times as many reads as before (~700 M reads). I hope that will be enough coverage to settle the question once and for all.
Edit.
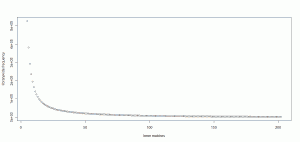
We repeated the above calculation with over 700 million 100 nt transcriptome reads. The k-mer distribution is shown below. They do not show any peak at any k-value.
Intuitively this result makes sense. A transcriptome contains many RNA sequences, each of which is expressed at a different level. Different k-mer distributions from different RNA sequences get averaged out, when we plot k-mer distribution of an entire RNAseq library.
