Note: These tutorials are incomplete. More complete versions are being made available for our members. Sign up for free.

De Bruijn Graphs for Repetitive Regions
To better understand the concepts presented in previous sections, we will construct de Bruijn graph for repetitive segment of a genome. In the following figure, two green regions are identical and yellow, blue and red regions are all distinct.
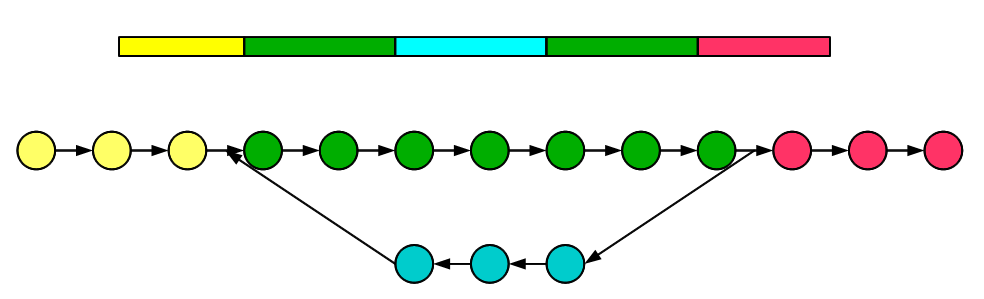
The de Bruijn graph for the segment is also shown with nodes for different regions marked in respective colors. The coloring scheme is somewhat simplified, because it paints various junction k-mers with single colors. However, the topography of construction is accurate, and we recommend you to pick a simple example and try the construction yourself.
You may observe that, in the above example, there is no easy way to go from the de Bruijn graph to the original sequence. The graph shown here can be resolved into many possible structures in nucleotide space. This multiplicity appears from presence of loop in the de Bruijn graph. In this context, we need to remind the readers that although the de Bruijn graph of a genome is unique, the inverse process of finding the underlying genome from its de Bruijn graph does not usually have unique solution.